

When the Data Goes Dark
Weekly Macroview and Game Plan – Oct 21 2025

We saw this coming. Last week’s plan called for patience and data confirmation before pressing risk, and that mindset paid off. The tape recovered from oversold levels, but the rebound lacked conviction as fear settled in and major economic data went dark under the government shutdown.
This week the market faces an unusual setup: limited data, heavy earnings, and a Fed flying half-blind.
Sentiment First: Fear & Greed
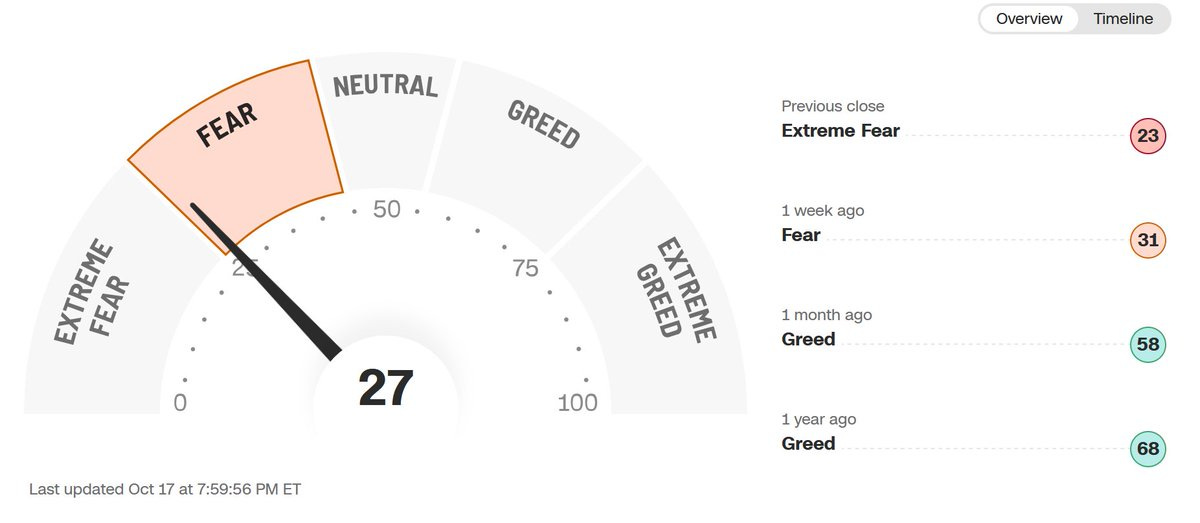
The Fear and Greed Index sits at 27 (Fear), down from 31 last week and 58 a month ago. That steady slide from Greed to Fear confirms that traders have shifted from FOMO to defense. Historically, when sentiment hits the 20–30 zone while price holds key trend levels, the odds of mean reversion improve.
This is not capitulation yet, but it does mean sellers are running out of marginal fuel. Fear in a flat tape often precedes stabilization.
The market does not need new buyers here. It just needs sellers to stop pressing.
Trend Check: Where the Charts Stand
sits around 664, trading in a tight consolidation between 655–666. The 50-day MA is climbing through 648–650, acting as the line in the sand.
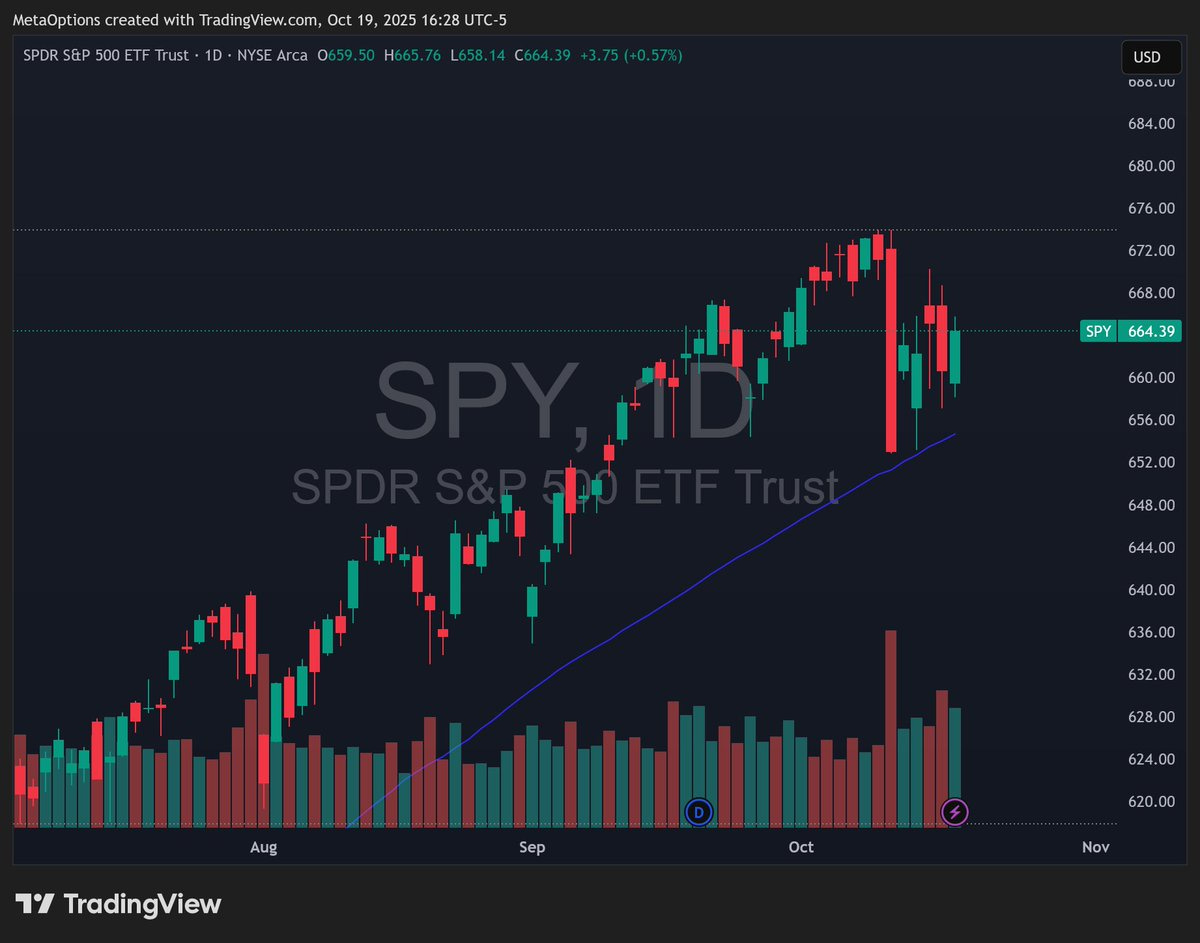
The daily MACD remains below the signal but is curling upward. On the 4-hour, momentum flipped neutral-to-bullish after a higher low near 650.
ADX sits in the mid-20s, showing a moderate trend but not yet a breakout. A clean move over 667 opens 672–675. Lose 655 and the next bids are 650 then 644.
The chart says balance. The sentiment says fear. That combination usually produces opportunity, not collapse.
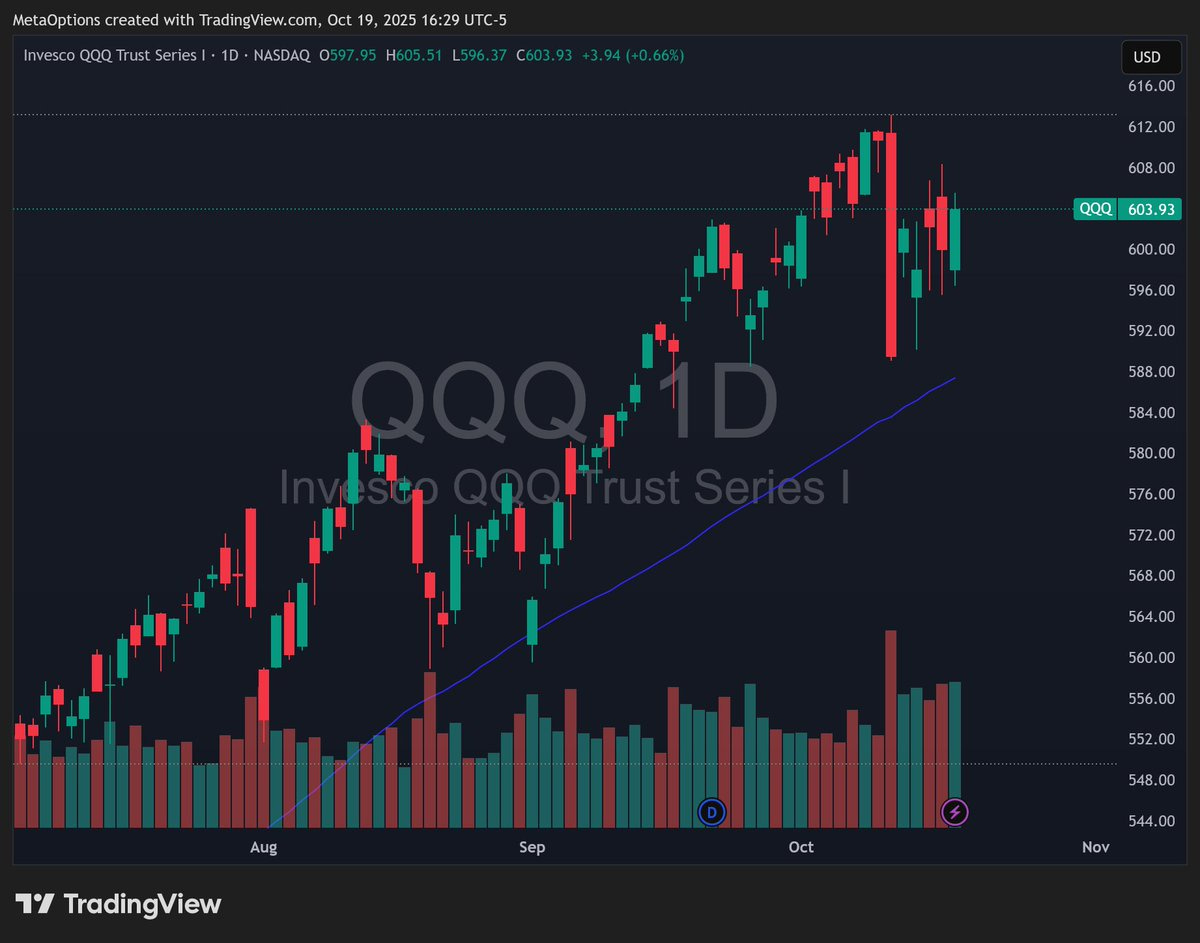
reclaimed 600 after defending 590 multiple times. The 50-day MA near 592 continues to hold, and RSI has turned back up through 50.
On the 4-hour chart, a small ascending triangle is forming between 595–605. Break above 606 confirms momentum and sets up 610–615. A failure back under 595 would send it toward 586 support.
Tech still leads when yields calm. Watch the 10-year Treasury and $DXY closely.
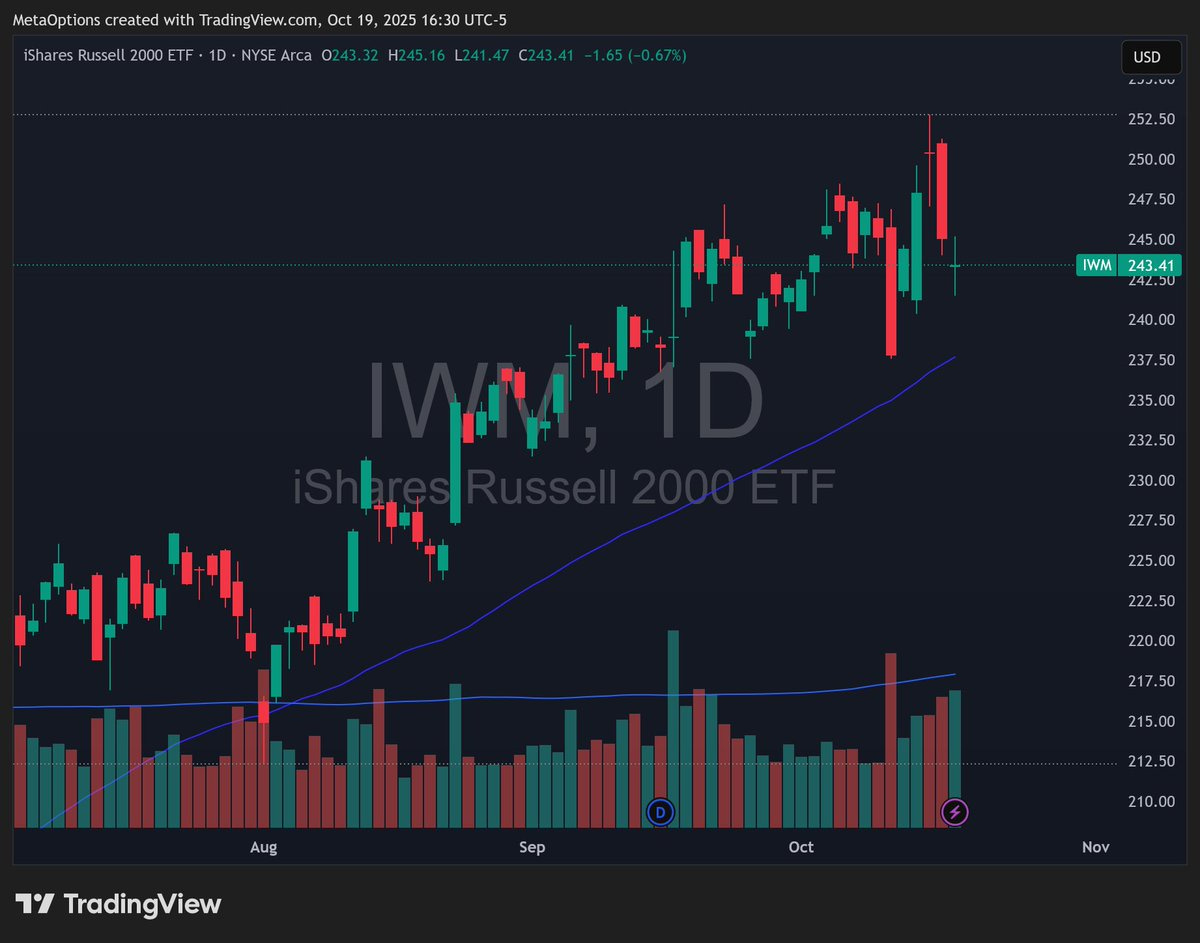
Small caps are still the laggard.
IWM 0.00%↑ bounced from 236 but stalled at 245 resistance. Until we see a daily close above 246, breadth leadership remains unconfirmed.
The 50-day MA is trending higher around 238, and volume picked up on Friday’s bounce. Constructive, but not convincing yet.
The Week Ahead: Catalysts That Matter
Data is limited this week because of the shutdown, so the market will trade mostly on earnings and housing data.
Monday, Oct 21 • Leading Economic Indicators (Sep) – expected soft again • Housing Starts & Building Permits (Sep) – watching for cracks in construction momentum
Tuesday, Oct 22 • No major economic data, but several earnings heavyweights report after the bell
Wednesday, Oct 23 • Existing Home Sales (Sep) – key gauge of consumer housing demand
Friday, Oct 25 • New Home Sales (Sep) and University of Michigan Consumer Sentiment (Final) – insight into confidence and spending appetite
Beyond that, all eyes turn to Oct 30, when the Q3 GDP advance estimate drops. That will be the next true macro catalyst.
Earnings Spotlight
This week’s earnings cluster will drive intraday volatility:
• Netflix ($NFLX) – expected EPS $6.94 on $11.5 B revenue. Streaming tailwinds remain, but guidance will matter more than subs. • Tesla ($TSLA) – production and margin updates dominate the tape. Market wants clarity after cost pressure headlines. • Texas Instruments ($TXN) – first look at semiconductor demand. Weak capex orders would confirm industrial slowdown. • IBM ($IBM) – defensive name. Steady prints help support the old-economy trade. • Newmont ($NEM) – a pure proxy for gold, which has seen record inflows. Watch how they frame 2026 guidance.
Volatility around these will likely dictate short-term sentiment for both
and
.
What the Street Is Saying
• The consensus still leans toward a soft-landing baseline for Q4, but with increasing hesitation given the data blackout. • The Fed remains in observation mode. Markets are pricing one 25 bp cut before year-end, but Powell will likely wait for cleaner data. • Earnings dispersion is widening. Mega-caps are holding up, while cyclicals and small caps underperform. • Commodities (especially gold) are emerging as relative strength plays amid policy uncertainty. • The dollar remains key. A pullback in DXY would support risk assets, especially tech and metals.
Wrapping It Up
Fear is back, but structure is intact. The 50-day moving averages on SPY 0.00%↑ / QQQ 0.00%↑ / IWM 0.00%↑ are still rising, which means the intermediate trend is not broken.
The risk is not in price action. The risk is in data absence and headline trades.
• Base case: SPY holds 655–660 and reclaims 667; QQQ holds 595 and pushes 605–610; IWM grinds 242–246 range.
• Risk case: Weak housing or poor earnings knock SPY under 650 and QQQ toward 586 support.
• Wild card: Fed chatter or tariff updates swing yields, which could instantly shift leadership between tech and value.
Trading Bias (CSP / Short Vol Lens)
With fear rising and trend intact, size = edge. Scale small, wait for red, and sell premium into panic not euphoria.
Bottom Line
Fear is high. Data is light. That means the market will move on emotion until next week’s GDP resets the narrative.
For disciplined traders, this is fertile ground: sell when others panic, buy when they exhale.
Stay patient, trade what’s in front of you, and let the tape-not the noise-decide.